
Data is everywhere. Whether you’re scrolling through social media, analyzing your workout stats, or keeping track of your spending habits, data touches almost every aspect of our daily lives. But not all data is created equal.
I want to talk about two of the most important types: discrete and continuous data. You’ve probably heard these terms before, but maybe you’re not quite sure what they mean or how they’re different.
What is Discrete Data?
Let’s start with discrete data. The easiest way to think about discrete data is by picturing things that can be counted. Discrete data consists of distinct, separate values. You can’t have a halfway point between two numbers in this type of data—only whole, individual units.
For example:
- The number of students in a classroom
- The number of pets you have
- The result of rolling a dice (1, 2, 3, etc.)
Each of these examples is countable in individual units. You either have 2 cats or 3—you can’t have 2.5 cats!
Common Characteristics
- Countable: You can clearly count the number of items or outcomes.
- Finite possibilities: Often, the data set has a fixed number of possible outcomes. Think about flipping a coin—only two outcomes: heads or tails.
- Often integer-based: Numbers are often entire and don’t have fractions or decimals.
Discrete data is typically visualized using bar charts, pie charts, or dot plots, as it’s easy to categorize each value and show differences between categories.
Examples of Discrete Data in Everyday Life
Still not sure how discrete data shows up in your daily life? Here are some real-world examples:
| Example | Type of Discrete Data | Description |
| Survey results | Number of people preferring coffee/tea | Responses are whole numbers, e.g., 30 people prefer coffee, 20 prefer tea |
| Social media followers | Number of Instagram followers | Followers are counted as whole numbers, e.g., 1,000 followers |
| Games | Rolling dice in a board game | Dice rolls result in fixed numbers, e.g., 1 through 6, no in-betweens |
What is Continuous Data?
@biostats_4d_rest_of_us Statistical Formula Series: Mean of Continuous Series data #maths #biostats #statistics #stem
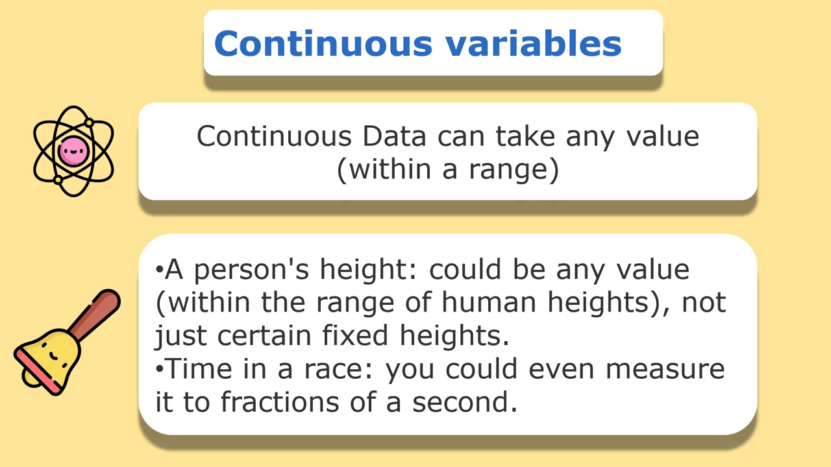
Now, on the other side of things, we have continuous data. Unlike discrete data, continuous data involves values that can take on any number within a range. Think of measurements that could, theoretically, be broken down into infinitely smaller units. Heights, weights, distances, and time are classic examples.
For example:
- Your height (maybe you’re 5.8 feet tall, but someone else might be 5.75)
- The temperature of your room
- The time it takes to commute to work
In these examples, the numbers can be more specific. I could measure my height in feet, inches, or even millimeters if I wanted. The key point here is that continuous data can include fractions and decimals.
Common Characteristics of Continuous Data
- Measurable, not countable: Continuous data is measured along a scale, not counted. You don’t count height; you measure it.
- Infinite possibilities: You can keep zooming in, and you’ll always find more detail in between. For instance, between 1.5 and 1.6, you can find 1.51, 1.511, and so on.
- Can include fractions/decimals: It often involves numbers that are not whole, which makes sense when measuring something like weight or time.
Visualization of continuous data typically uses line graphs or histograms, which better show trends and the smooth transitions between values.
Examples in Everyday Life
Continuous data is literally everywhere in daily life, especially when measuring things. Let’s take a look:
| Example | Data Type | Explanation |
| Driving | Continuous | Speed can take any value (e.g., 45.1 mph, 50.3 mph), not fixed to whole numbers. |
| Fitness Tracking | Discrete (steps) / Continuous (distance) | Steps are countable and whole numbers, but distance (in miles/km) is continuous, with fractional values possible. |
| Weather Reports | Continuous | Temperature can vary smoothly (e.g., 72.5°F to 72.6°F) without jumping between values. |
How to Know if Data is Discrete or Continuous
It might not always be obvious whether you’re dealing with discrete or continuous data, so here are a few pointers to help you figure it out:
- Can it be counted?: If you can count the items, it’s probably discrete. If you need to measure it with a tool (like a ruler or a thermometer), it’s likely continuous.
- Are there only specific values?: Discrete data tends to have limited, exact values. Continuous data fills in all the gaps between those values.
- How is it displayed?: Discrete data often uses bar charts or pie charts, while continuous data uses line graphs or histograms.
Why Does the Distinction Matter?
You might be wondering why we even bother making a distinction between discrete and continuous data. What’s the big deal? Well, it’s important because the type of data influences how you analyze it, how you present it, and even which statistical methods to apply.
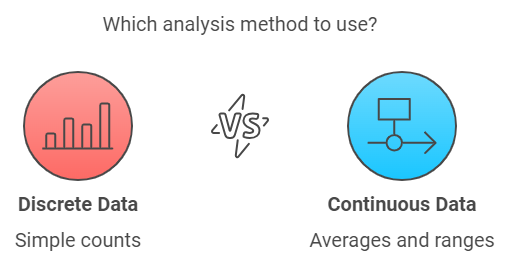
Analysis Methods
| Data Type | Analysis Methods | Example Questions |
| Discrete Data | Simple counts or frequencies | “How many students got an A?” |
| Continuous Data | Averages, standard deviations, ranges | “What is the average height in the class?” |
Visualization Techniques
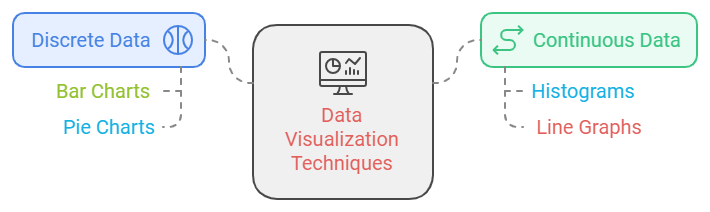
The way you visualize the data also changes depending on its type:
| Graph Type | Data Type | Description |
| Bar Charts & Pie Charts | Discrete Data | Categories are separated, allowing easy visualization of differences between them. |
| Histograms & Line Graphs | Continuous Data | Show smooth transitions and trends over time or across ranges. |
So if you are student, read bout game-based learning
Using the right tools and techniques will help ensure you communicate the story your data is telling effectively.
What About Mixed Data?
Sometimes, you’ll encounter scenarios where both discrete and continuous data come into play. Let’s say you’re analyzing the performance of an athlete. The number of games they’ve played is discrete, but their scores or completion times are continuous.
Blending these data types can provide a more holistic view of performance. By combining discrete and continuous data, you can create more detailed models that help with predictions, comparisons, and conclusions. It’s common in fields like machine learning or statistics, where multiple data types come together to solve complex problems.
- Know your tools:Different statistical tools are used for discrete versus continuous data. If you’re unsure, look into methods like regression analysis for continuous data and chi-square tests for discrete data.
- Visualize correctly: Choose the right type of graph to represent your data. This will make your findings more accurate and easier to interpret for others.
- Double-check your assumptions: Sometimes data can appear discrete but is actually continuous in nature, or vice versa. Check the context!
The Bottom Line
By now, you’ve got a clearer picture of what separates discrete and continuous data. The distinction might seem subtle, but it has big implications for how we handle, analyze, and visualize information.