So many parents and guardians feel relieved when kids hop onto buses each morning. After all, that iconic vehicle remains a favored way to get children from one point to another. Yet plenty of people might be shocked by data surrounding accidents involving those massive vehicles.
Nobody wants to imagine a scenario involving student transport gone wrong, yet it happens more often than the average person might guess.
Today, we’re going to take a thorough look at recent numbers and try to get a glimpse into how frequently incidents occur, who is most at risk, and how authorities are working to keep youngsters safe. Let’s get started.
Annual Accident Figures
View this post on Instagram
National Highway Traffic Safety Administration research spanning 2013 to 2022 points to 976 fatal accidents across the United States that were related to school buses. In all, 1,082 individuals lost their lives over that period. Put plainly, that averages out to around 108 deaths each year.
Another notable statistic is the injury count, which sits at roughly 132,000 for the entire decade—about 13,200 each year. By no means is anybody proud of those numbers, yet it’s crucial to place them in the broader context of overall transportation statistics.
A closer look at specific years uncovers some intriguing peaks and dips:
Those figures alone might stoke concern, but they paint only part of the picture. Many people fail to realize that private automobiles and other forms of transit exhibit far higher accident rates. Yes, accidents involving big yellow buses happen, but a sliver of context is essential.
Fatalities vs. Injuries
- Fatal accidents (2013–2022): 976 recorded incidents
- Total deaths in that span: 1,082
- Annual average: About 108
- Overall injuries: About 132,000
The distribution of harm reveals crucial details about how collisions typically unfold. Not every fatality or injury involves a student on the bus. Most fatalities occur among drivers or passengers in other vehicles.
With thousands of injuries occurring annually, many individuals involved in school bus accidents may need to navigate insurance claims. Mighty offers insights on settling claims without legal representation.
Safety in Numbers
The school bus is one of the safest modes of transportation, but cars illegally passing school buses can pose a significant threat to children.
Before you head to the bus stop, review these tips from @NHTSAgov to keep your kids safe: https://t.co/3KkBhkbfM6#SchoolBusSafetyWeek pic.twitter.com/33lizr9MdX
— U.S. Department of Education (@usedgov) October 18, 2023
Despite the presence of annual fatalities, buses remain among the safest ways for students to travel. Agencies such as the U.S. Department of Transportation note that school buses represent under 1% of annual traffic fatalities.
Compare that statistic to overall road incidents, and it’s evident that personal vehicles place children in far riskier scenarios. Plus, the NHTSA estimates that students are around 70 times more likely to arrive safely at school by riding a bus instead of a car.
What Contributes to That Safety Record?
- Sturdy construction: The vehicle’s frame is designed to absorb impact effectively.
- Bright color and flashing lights: High visibility reduces the odds that another motorist fails to see it.
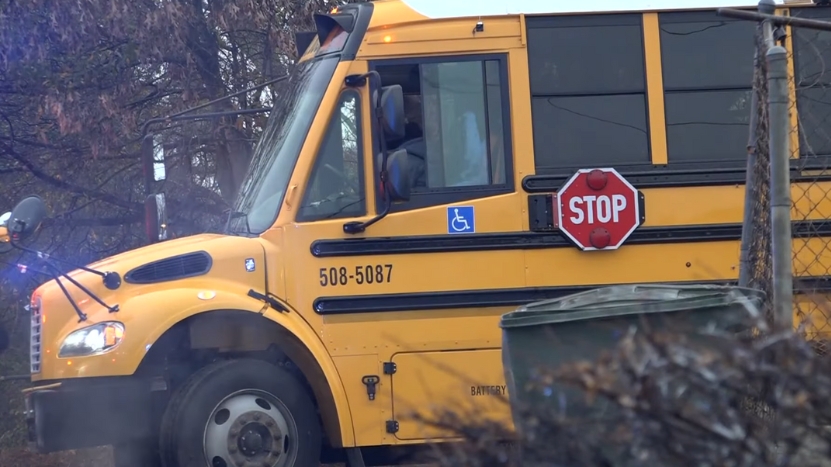
- Stop-sign arms and crossing gates: Additional external features help warn other drivers to halt when kids board or exit.
- Stringent federal regulations: Safety guidelines mandate specific equipment requirements, ranging from seat belts in lighter buses to thoroughly tested seating arrangements in larger ones.
One might argue that those design elements are a bit over the top, but try telling that to parents who want the safest commute for their kids. In a world where shortcuts are often the norm, dedicated safety measures for childhood transport are more than a little refreshing.
A Look at Demographics
It’s easy to assume that children on board would constitute the majority of fatalities. The numbers tell a different story.
NSC Injury Facts research underscores that most individuals killed in these collisions occupy other vehicles involved.
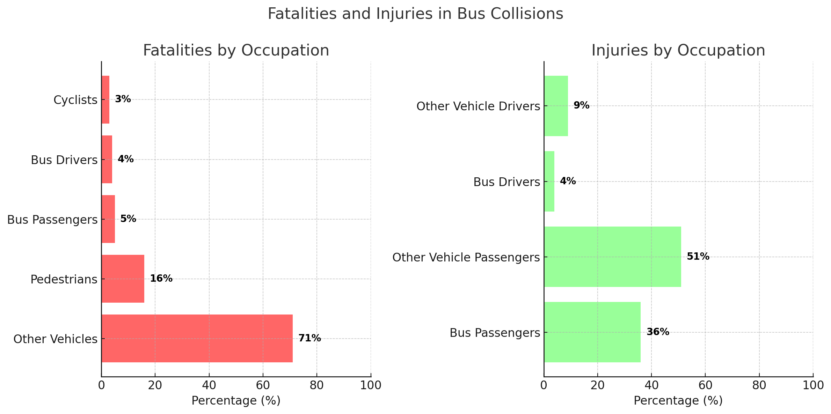
Specifically, 71% of those who died were not on the bus. Then one finds smaller but significant portions involving pedestrians (16%), bus passengers (5%), bus drivers (4%), and pedal cyclists (3%).
For injuries, the proportions shift somewhat. Bus passengers make up 36% of injuries, and drivers add up to 9%. Meanwhile, individuals in other vehicles account for 51%.
Those final details confirm a long-standing concern among traffic safety experts: a collision between a massive bus and a regular car can inflict serious damage on anyone inside a typical passenger vehicle.
Buses have more bulk, making them better able to withstand the worst outcomes—though it’s no parade for the drivers and passengers within, either.
Key Takeaways on Who’s Affected
- Majority of fatalities: Occupants of non-bus vehicles
- Pedestrian involvement: 16% of all recorded fatalities
- Bus passengers and drivers: Relatively low proportion of deaths (9% combined)
- Injuries: More evenly distributed, with a substantial share involving riders on the bus
Where and When Accidents Happen
Geographical patterns reveal that Texas, Florida, and Georgia often lead in both fatal accidents and overall fatalities linked to bus incidents.
According to the Campus Safety Magazine, Texas took the top spot between 2013 and 2022, logging 75 crashes resulting in 87 fatalities.
Florida was right behind with 74 crashes and 76 fatalities, while Georgia recorded 60 crashes and 65 fatalities.
Bigger states with extensive roads tend to see higher volumes of commercial and school-related transportation. That combination can elevate the risk of collisions.
Timing Matters
One might guess that buses would be on the road mainly in the morning and afternoon. That guess lines up with data showing that a substantial portion of these accidents occurs around pick-up and drop-off times. According to NHTSA research:
Anyone who has ever navigated morning or mid-afternoon traffic near a school can attest to the congestion and occasional confusion.
Kids are crossing the street in multiple directions, cars are jockeying for position in drop-off lanes, and crossing guards do their best to keep things orderly.
It’s hardly shocking that the most active windows for student pickups and drop-offs also coincide with elevated risk.
Points of Progress and Persistent Challenges
Many experts in traffic safety and child welfare point to ongoing attempts to reduce the annual accident rate. Some communities experiment with innovative signage, improved road markings, or better lighting around critical bus stops.
Others invest in advanced driver-assistance systems. Yet it’s worth acknowledging that no measure can guarantee a perfect track record.
Buses share highways, city streets, and rural roads with a wide range of traffic. Collisions sometimes happen when drivers in personal vehicles ignore basic road rules. Then there are the hazards of poor weather conditions, mechanical failures, or driver error.
The robust build of a bus may mitigate some danger, but there is always a baseline level of risk anytime one merges onto a busy road. Let’s just say that no amount of bright paint or cautionary signage can entirely eliminate driver negligence elsewhere.
Post-high school paths can also play a role, as young adults, who may soon be commuting independently, must be educated on road safety and the importance of caution.
There’s also the factor of funding. Many districts face tight budgets, forcing them to weigh big purchases—like upgraded buses or advanced safety technology—against other educational priorities.
When money is scarce, it can be tough to justify pricey new vehicles over teacher raises or facility repairs. That tug-of-war of priorities means safety enhancements sometimes arrive more slowly than parents or advocates would hope.