The United States is home to 26,727 high schools as of 2025, a figure that captures both public and private institutions shaping the nation’s secondary education landscape.
That number alone hints at a sprawling system, but it’s the layers beneath public versus private breakdowns, geographic disparities, student populations, and funding trends—that reveal the true scope and complexity.
I’ve sifted through the latest data, blending stats with insights, to give you a sharper picture of what’s happening in American high schools today.
Let’s dissect it step-by-step, from the raw totals to the forces driving them, and see what it all means for the future.
Key Takeaways
The High School Headcount: 26,727 and Counting

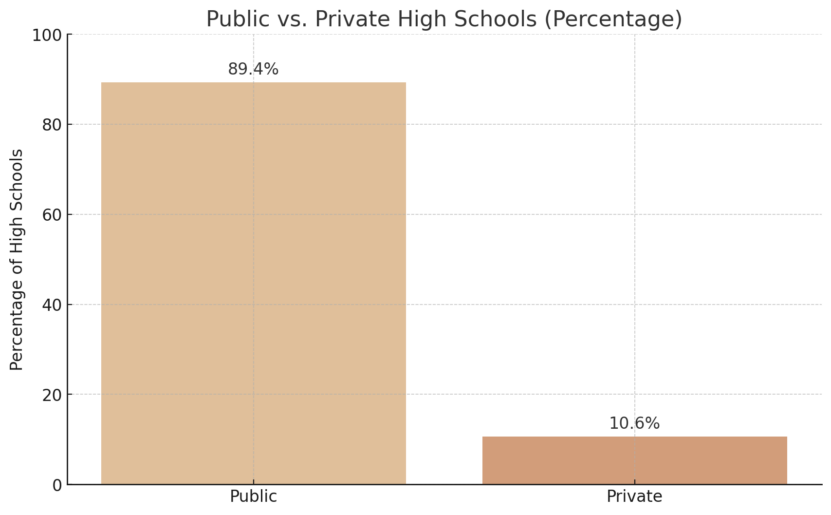
At its core, the U.S. high school tally stands at 26,727, according to the most recent figures from Q1 2024, adjusted for 2025 trends. Of these, 23,882 are public—roughly 89%—relying on government funding to educate students tuition-free.
The remaining 2,845 are private, comprising 11%, often sustained by tuition and offering specialized or religious curricula. Together, they form a critical pillar within the broader tapestry of 115,171 U.S. schools, which span K-12, special education, career training, and adult programs.
Public vs. Private: A Quantitative Split
The dominance of public high schools isn’t surprising—83% of all U.S. schools (95,852) are public, and high schools follow suit.
That leaves private institutions as a smaller but significant minority.
Here’s the breakdown:
Public high schools serve as the backbone, driven by accessibility and scale.
Private ones, though fewer, often cater to niche demographics, think Catholic schools or elite academies—offering diversity in educational approach.
The 89-11 split mirrors broader K-12 trends but underscores a key tension: universality versus exclusivity.
Geographic Distribution: Where High Schools Cluster
High schools aren’t evenly distributed—geography plays a massive role.
California leads with 3,900, a figure tied to its 6.86 million K-12 students and 10,325 total public schools as noted by Census.gov.
Texas follows with an estimated 3,500 high schools, supporting 5.84 million students.
Contrast that with Delaware, where just 83 high schools serve a modest population of under 140,000 K-12 students as noted by the General Assembly.
Here’s a snapshot of the extremes:
State
High Schools
Total Public Schools
K-12 Students
California
3,900
10,325
6.86M
Texas
~3,500 (est.)
9,101
5.84M
New York
~1,500 (est.)
4,802
3.17M
Delaware
83
229
<140K
California’s density reflects its population and economic heft, while Delaware’s sparsity aligns with its small size.
This variance isn’t random—it’s a function of student enrollment, state priorities, and historical investment in education infrastructure.
Student Populations: Numbers and Trends
High schools aren’t just buildings—they’re ecosystems teeming with students.
In 2023-2024, 3.47 million graduated nationwide—3.2 million from public schools and 244,929 from private ones as noted by COE.
Enrollment data from 2022 pegs 9-12th graders at around 15.5 million, a figure holding steady despite post-COVID fluctuations. Graduation trends offer a clearer lens:
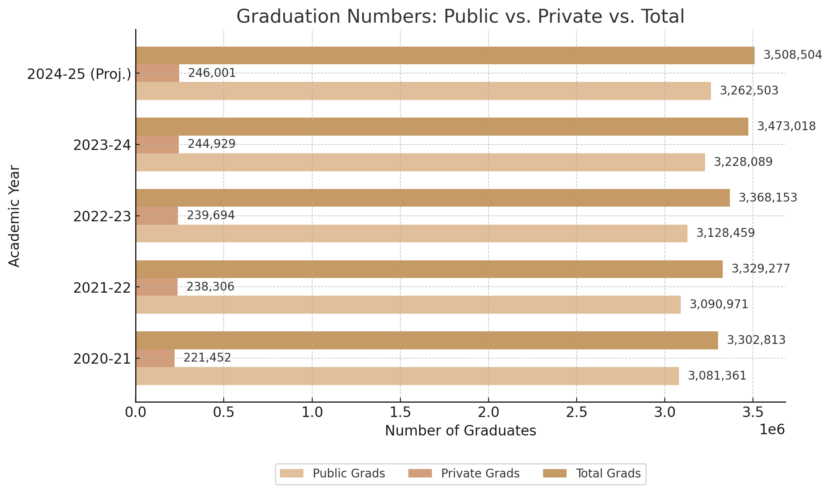
Projections show a peak at 3.5 million in 2024-25, followed by a slight decline.
That dip—down to 3.25 million by 2027-28—hints at demographic shifts, like lower birth rates from the 2010s trickling up.
Standouts and Specializations
Quality varies widely. CGS notes that North Carolina’s Early College at Guilford topped the 2023-2024 rankings, excelling in academics and diversity as a public standout.
Private schools, meanwhile, often boast smaller classes and tailored programs, with student bodies averaging 65% white versus 47% in public charters.
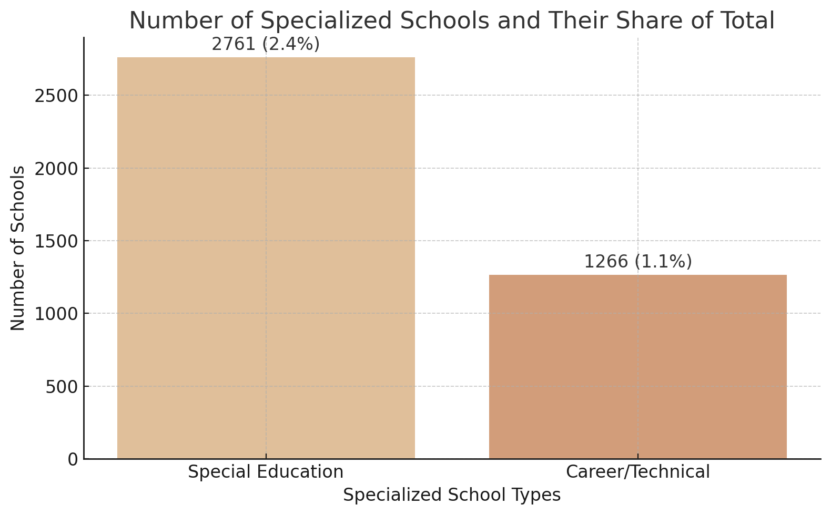
Beyond the mainstream, 2,761 special education schools (2% of the total 115,171) cater to students with disabilities, while 1,266 career/technical schools prep teens for trades both subsets impacting high school dynamics.
Funding: The Money Behind the Mission
Resources matter, and spending per pupil reveals stark contrasts.
New York’s public schools lead with $24,040 per student—think upgraded facilities and robust staffing as noted by Press Release.
The District of Columbia follows at $22,759, with Connecticut, New Jersey, and Vermont rounding out the top five.
Nationally, the 2019-2020 average was $13,440—meaning top spenders double the baseline.
State
Spending Per Pupil
Variance from Avg.
New York
$24,040
+$10,600
D.C.
$22,759
+$9,319
Connecticut
$20,635
+$7,195
New Jersey
$20,021
+$6,581
Vermont
$19,340
+$5,900
Higher spending often correlates with better outcomes more AP classes, tech access, or counselors but it’s not a silver bullet. States like California balance high school counts with moderate per-pupil spending ($12,000-$14,000 range), leaning on volume over intensity.
Contextualizing High Schools: The 115,171 Ecosystem
High schools don’t exist in a vacuum they’re part of the 115,171-strong U.S. school network.
Elementary schools dominate at 64,311, middle schools add 14,677, and K-12 combined schools (11,518) blur grade lines.
Public schools (95,852) dwarf private ones (19,329), with 43% of public schools qualifying as Title I serving high-poverty areas with extra federal funds. as noted by MDR Education.
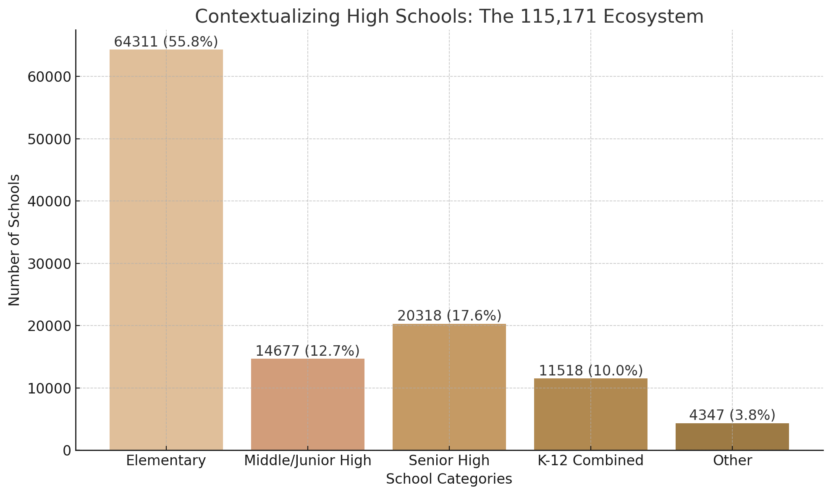
High schools’ 26,727 exceeds the 20,318 “senior high” figure due to combined K-12 overlaps—a nuance in classification.
What It All Means
The 26,727 high schools reflect a nation balancing scale, equity, and innovation. Public dominance (89%) ensures broad access, but private options (11%) signal demand for alternatives.
Geographic disparities—3,900 in California versus 83 in Delaware—mirror population density and policy choices, while funding gaps (New York’s $24,040 vs. the $13,440 average) expose resource inequities.
Graduation rates climbing to 3.5 million by 2025 suggest resilience, yet looming declines hint at demographic headwinds.
High schools are more than numbers—they’re engines of opportunity.
California’s volume-driven approach contrasts with Delaware’s lean efficiency, and specialized schools (special ed, career/tech) fill critical gaps.
Funding remains a fault line: states spending big often lead in outcomes, but national averages lag, challenging uniformity.
As 2025 unfolds, these 26,727 institutions will keep evolving—adapting to tech, diversity, and economic shifts.
The data’s clear: high schools are a microcosm of America’s educational ambitions, flaws, and potential. What’s your read on where they’re headed?
Methodology
- We compiled data from Q1 2024 sources like MDR Education and Harvard, projecting 2025 trends based on historical patterns.
- Public and private high school counts were cross-checked against national totals (115,171 schools) for consistency.
- Geographic and funding stats were sourced from state-specific records (e.g., Statista, Research.com) to map disparities.
- Graduation and enrollment figures were analyzed from multi-year datasets to identify peaks and declines.
- Insights were synthesized into a concise narrative, blending numbers with context for clarity and impact.
References
- Research.com – American School Statistics
- U.S. Census Bureau – Census Report on Education Statistics
- Delaware General Assembly – Delaware School Districts and Public Schools Statistics
- National Center for Education Statistics (NCES) – Public School Enrollment
- Council of the Great City Schools (CGCS) – Top U.S. High Schools Ranking
- National Center for Education Statistics (NCES) – Press Release on School Funding
- MDR Education – How Many Schools Are in the U.S.?